Financial Strength Compounds: How Cash-Rich Systems Are Increasing Their Advantage
October 23, 2025

The gap in health system profitability is widening. But not for the reasons most people think.
Look at the median health system operating margin versus net income margin over the past four years. Operating margins have remained relatively stable, hovering between breakeven and 2.8 percent. But net income margins tell a completely different story. They've swung from 12.4 percent in 2021 to negative 4.9 percent in 2022, then back to 6.6 percent in 2024. As shown in the chart below, these two measures of profitability have diverged dramatically.

The difference between these two metrics? Investment income.
Mayo Clinic provides a stark example. In Q2 2025, Mayo generated $871 million from its investment portfolio compared to $171 million from hospital operations, five times more from investments than from patient care. For the full year 2024, that gap widened further: $1.8 billion from investments versus $275 million from operations. Mayo sits on $22 billion in investable assets, and when markets perform well, that portfolio generates returns that overshadow what even world-class hospital operations can produce.
But this isn’t a Mayo story. This analysis examines 146 not-for-profit health systems to understand how investment income is reshaping the competitive landscape. What I found suggests that cash position, not just operational performance, increasingly determines which systems are set up to thrive.
Two Measures of Profitability Tell Different Stories
Healthcare executives track operating margin closely, and for good reason. Operating margin measures profitability from core operations: revenue from patient care minus the costs to deliver that care. It reflects how well a hospital or health system manages its fundamental business of treating patients.
Net income margin tells a different story. It includes everything. Operating results plus investment returns, contributions, and other non-operating activities. For most industries, these two metrics track relatively closely. But for not-for-profit health systems sitting on substantial investment portfolios, they can diverge significantly.
The focus on operating margin isn't wrong. It measures what leadership can directly control through operational decisions: labor management, supply chain efficiency, revenue cycle performance, and clinical productivity. A health system can't function long-term with significant negative operating margins, regardless of investment returns.
But operating margins miss a huge component of what can actually drive financial performance at large health systems: investment income.
Since October 2022, we've seen one of the strongest bull markets in recent history. The Dow Jones is up 58 percent, the S&P 500 has gained 86 percent, and the Nasdaq has more than doubled with a 120 percent increase. For health systems with substantial investment portfolios, those returns have fundamentally changed their financial picture. Operating margins have improved modestly. Net income margins have soared.
The Cash Divide Creates a Profitability Chasm
Think about two people who both earn $75,000 annually with$70,000 in expenses. Both save $5,000 per year. Person A has $1 million in stock market investments. Person B has $50,000. When the stock market increases 10 percent, Person A's net worth grows by roughly $100,000 while Person B's increases $5,000. For Person A, market returns completely overshadow the $5,000 in annual savings.
Health systems work the same way.
Consider two health systems, each with between $4-5 billion in net patient revenue. System A operated with 415 days cash on hand and generated a 3.3 percent operating margin in FY 2024. System B operated with 147 days cash and generated a 1.8 percent operating margin. The operational difference? 1.5 percent. However, System A's investment income equaled 15.2 percent of operating revenue while System B's equaled just 1.6 percent. Investment returns created a 13.6 percentage point advantage that far exceeded any operational performance gap between these similarly-sized organizations.
To determine if this is a one-off example or a larger trend, I segmented the 146 systems into quartiles based on days cash on hand, a metric that measures how long a health system could continue operating if all revenue stopped. The top 25 percent of systems by cash position versus the bottom 25 percent show dramatically different financial outcomes. Not because one group operates more efficiently, but because one group has significantly more cash to invest.
As shown in the scatter plot below, the relationship between days cash on hand and investment income as a percentage of operating revenue is clear. Systems in the bottom quartile generated median investment income equal to 2.3 percent of their operating revenue in FY 2024. Systems in the top quartile generated 9.5 percent. That's a 7.2 percentage point difference driven entirely by investment returns.
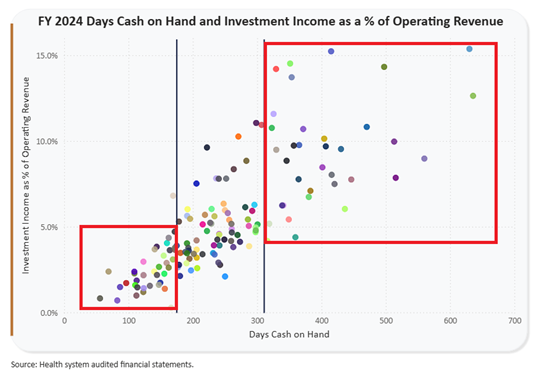
Remember from the opening: the median operating margin for all systems was 1.7 percent in 2024. High cash systems added 9.5 percentage points from investments. Low cash systems added 2.3 percentage points. The impact of investment income is significant.
With continued strong market performance in Q2 2025, the investment income gap accelerated further. Low cash systems generated 4.1 percent of operating revenue from investments. High cash systems generated 16.7 percent.

This isn't about one group having better investment managers or making smarter allocation decisions. This is simple math. When you have $2 billion in investable assets versus $200 million, a 10 percent market return generates $200 million versus $20 million. Scale matters. Cash position matters. And in a bull market, that advantage compounds rapidly.
The Pattern Extends Beyond Large Systems
To test whether this pattern holds at smaller scales, I ran a similar analysis on 147 stand-alone hospitals. The results mirrored what I found in the health system data. High cash hospitals generated significantly more investment income as a percentage of operating revenue compared to low cash hospitals, creating the same profitability chasm despite similar operational performance.
Even among the smallest organizations, the pattern persists. When filtering to just 62 hospitals with net patient revenue between $75 million and $299 million, the cash position advantage remained consistent.
The fundamental dynamic remains identical. Cash position determines financial flexibility and sustainability, whether you're a $5 billion health system or a $150 million community hospital.
Conclusion
Operating margins tell us how efficiently health systems deliver patient care. Net income margins tell us which systems are positioned to win.
The analysis reveals a healthcare landscape increasingly divided by cash position. High cash systems generate roughly four times more investment income as a percentage of operating revenue compared to low cash systems. Investment returns now explain most of the profitability difference between health systems, not operational performance.
But the real story is what comes next. Financial strength compounds.
Cash-rich systems can subsidize low-margin service lines with investment returns, maintaining community access while competitors exit unprofitable markets. They can fund strategic initiatives without relying solely on operating cash flow. They can absorb temporary operational losses without cutting essential services. And large systems can acquire struggling hospitals, adding both revenue scale and investable assets to their portfolios.
Low cash systems can't do any of these things. And they fall further behind each quarter the stock market performs well.
We've seen three years of exceptional market returns. During this period, the investment income gap between high and low cash systems hasn't just persisted. It's accelerated.
In a market where money makes money, liquidity isn’t just a buffer, it’s a competitive strategy.